Store Statistics

Swing Store – How to use store statistics
Store statistics is an admin page where you can check the amount and quantity of goods operated and sold in the swing store.
You can check order amount and order quantity by period.
You can check the order amount by product and the number of readings per product by statistics.
Move to store statistics menu
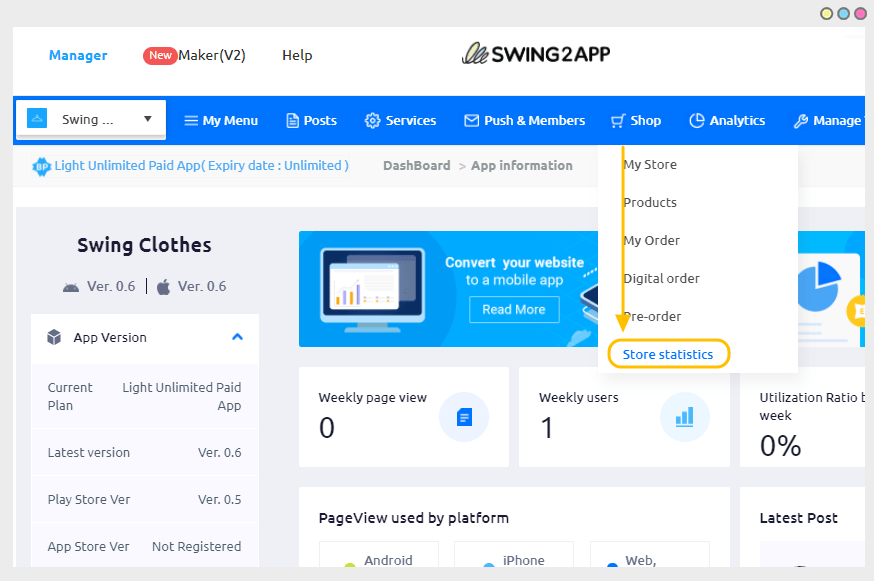
Go to Swing store Menu – [Store Statistics]
1. Monthly order amount
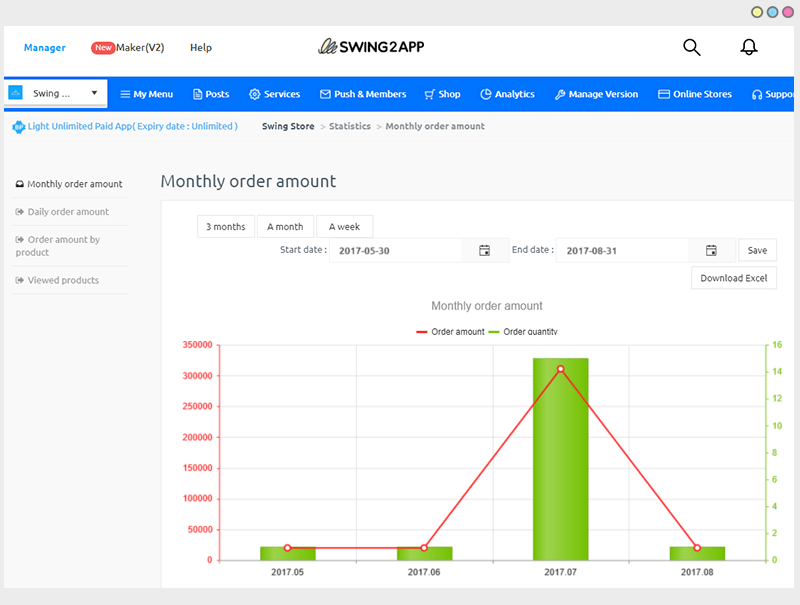
The monthly order amount is a statistic that allows you to see the sum and quantity of orders paid each month.
The monthly order amount can be viewed as a sum of the order amount and the sum of the order quantity.
You can also check the order amount and order quantity statistics separately.
1-1 Monthly Order Amount
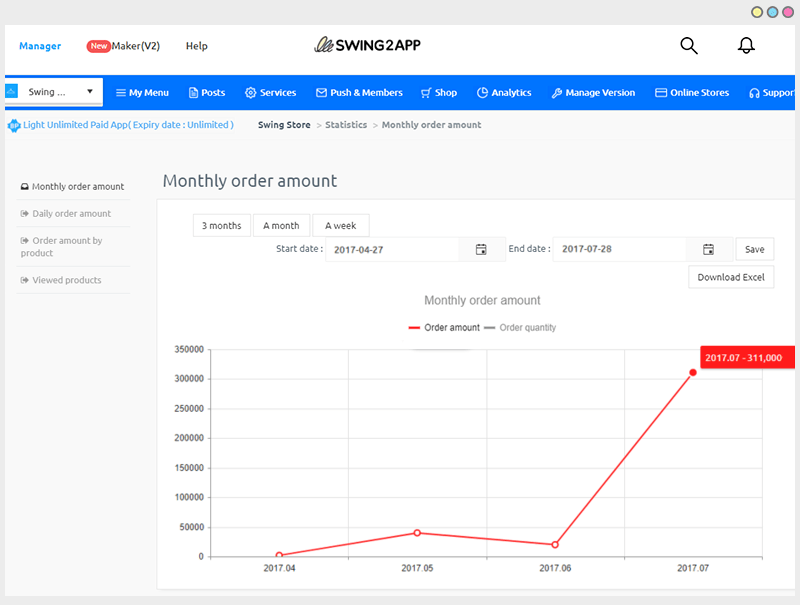
After applying the time period you want to check, you can see the order amount for each month.
1-2 Monthly orders
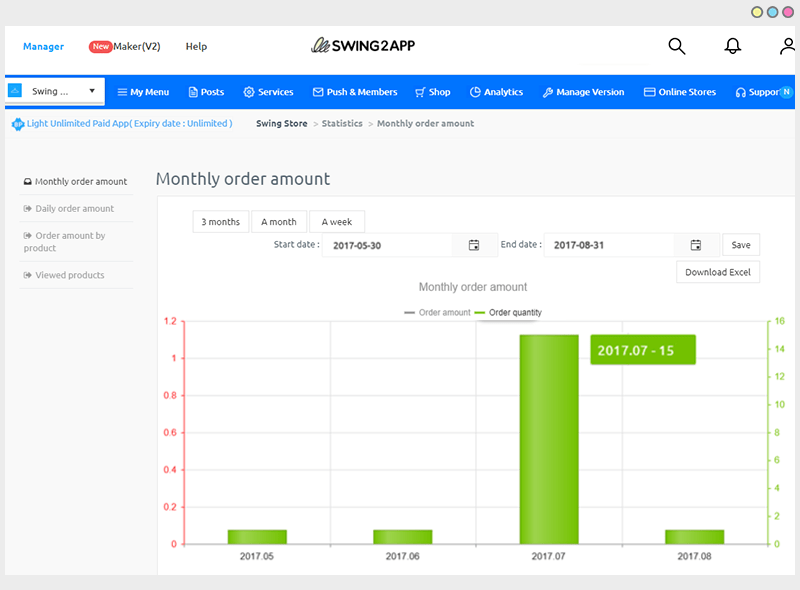
Similarly, if you check the number of orders, you can check the number of items ordered by the time they are applied.
2. Daily order amount
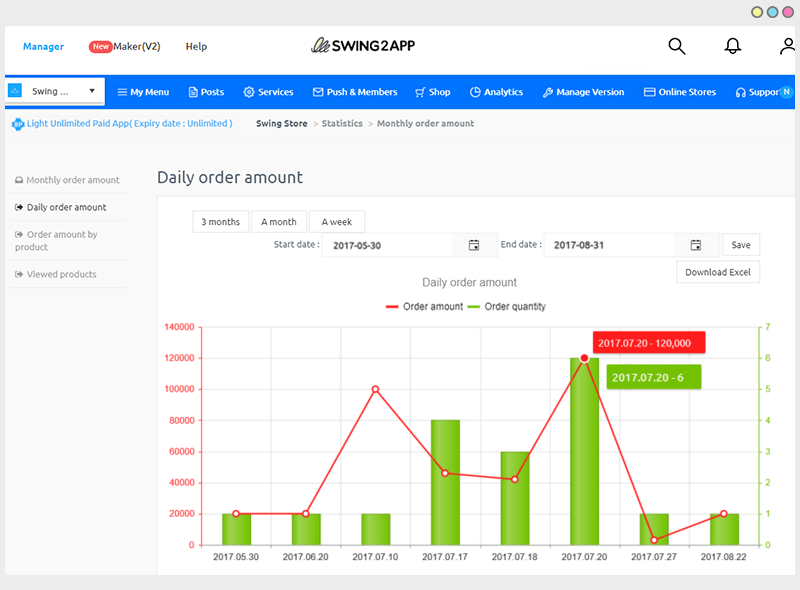
The daily order amount is a statistic that allows you to see the sum and quantity of orders paid for during the day.
Just like your monthly statistics, you can select the date and see your order value and quantity.
3. Order amount by product
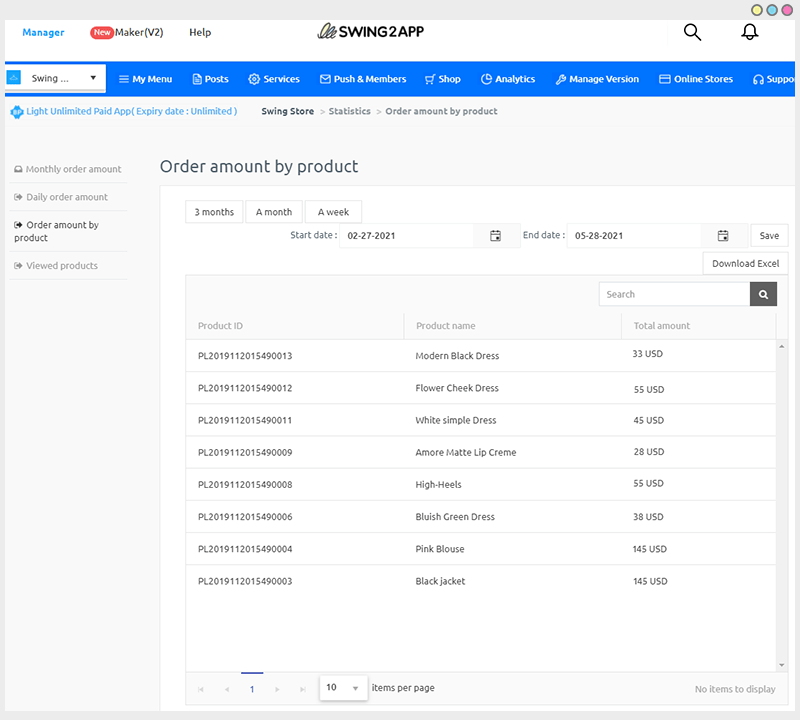
You can check the amount paid for each product by the amount of each order.
Apply a date range to see the total amount paid for each item ordered during that period.
▶ Excel Download
All menus on the statistics page can be downloaded and verified by Excel.
If you are documenting, please check the statistics by product through Excel download.
4. Viewing Products
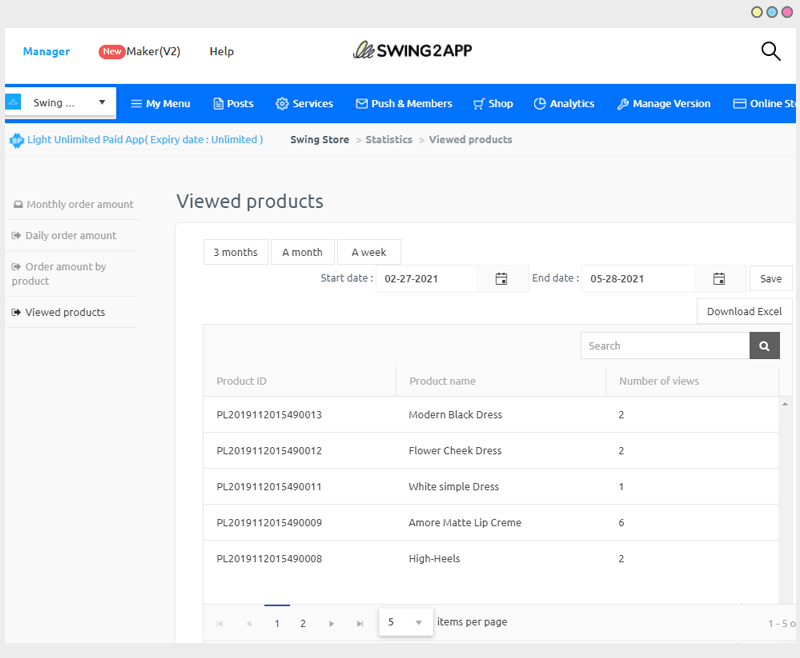
You can check how many times you have viewed the product in the app and how many times you have viewed it by product.
You can use store statistics to see which items are sold high, as well as order quantities and amounts for the month.
It can be downloaded and used with Excel so you can manage them separately.
If you are running the app using the swing store, please use the store statistics menu to help you operate the app.
Last updated